One platform.Smarter physical security decisions.
Connect what happens across your security operation with the insight needed to manage exposure, priorities and investment.
Governed by ISO 31000, aligned with ASIS and ESRM risk logic.
What's happening?
Events & signals
Where are we exposed?
Risk & controls
What needs attention?
Performance & actions
Where should we invest?
Cost & priorities
Four questions. One connected environment.
The questions every security leader has to answer, and how Pronect answers them.
01
What's happening?
Events & signals
Bring relevant security information together from operational reporting, intelligence and connected data sources, and turn it into a structured view of events across your security environment. Pronect links that information to risk and performance context, helping teams identify what matters and where attention is required.
See the events that matter, in the context needed to act.
Platform capabilities
02
Where are we exposed?
Risk & controls
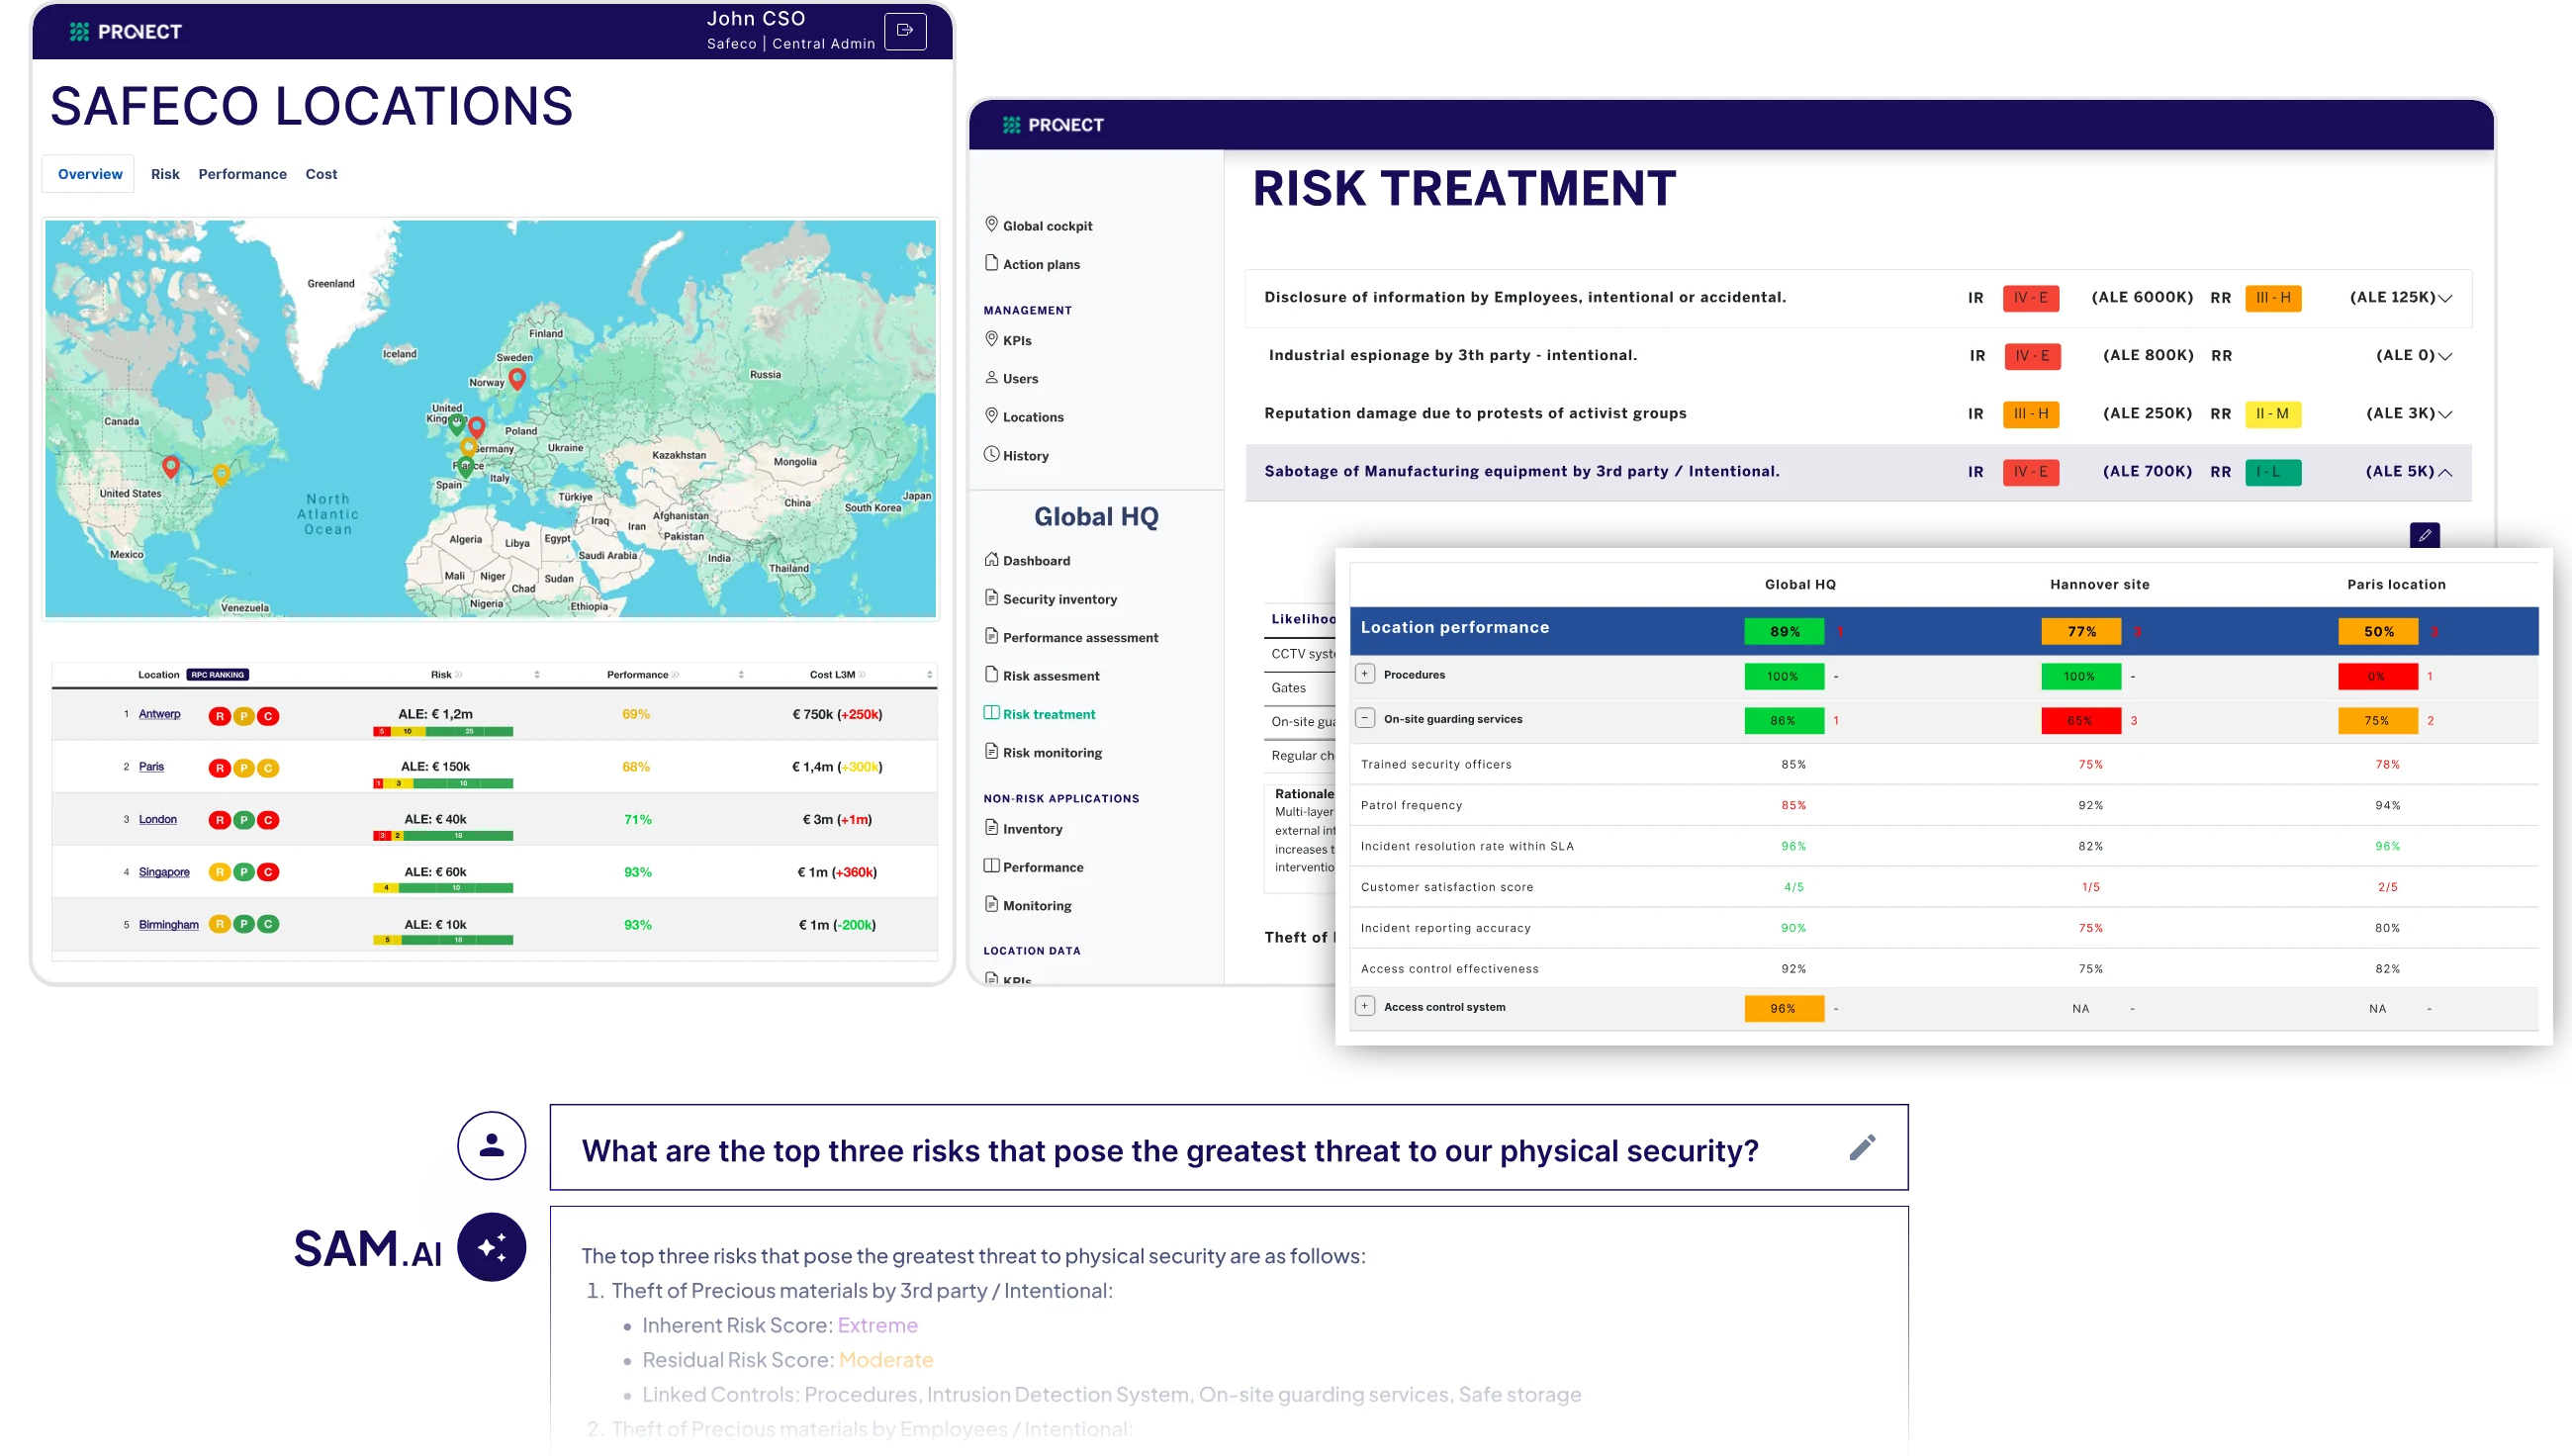
Risk assessments lose their value when they live in a static register, disconnected from the security controls they depend on. Pronect keeps them connected. A built-in security risk taxonomy lets any manager, not only a risk specialist, write consistent risk statements across every site. You then score likelihood and consequence on a customisable scale that reflects your own financial and reputational impact.
Each risk is linked to the controls meant to reduce it: the products, services and procedures protecting the site. With an ISO 31000-compliant method you see the inherent risk, the mitigation in place and the residual exposure that remains, in money, where your data supports it. As controls and treatment change, that residual exposure updates with them rather than ageing in a document. When events on the ground suggest a risk is shifting, Pronect shows where a review is needed.
Understand where exposure remains, and exactly what is driving it.
Platform capabilities
03
What needs attention?
Performance & actions
A control that is not working as it should leaves you carrying more risk than you think, because a risk assessment is only as reliable as the controls behind it. That is why performance needs to be managed, not assumed. In Pronect you keep one inventory of the controls at every location, with the provider and service level agreed for each. You score their performance quickly and consistently against your own expectations, instead of chasing spreadsheets every month.
Planned versus executed activity shows where delivery is falling short, and you follow provider performance the same way, so an underperforming supplier is visible rather than assumed. When something needs fixing, you give it an owner and a due date and follow it through, with global and site dashboards showing management whether the operation is actually performing.
Turn performance data into clear, owned management priorities.
Platform capabilities
04
Where should we invest?
Cost & priorities
Security budgets are usually discussed as spend, because spend is the only number on the table. Pronect brings cost into the same view as risk and performance (planned against actual, by control, site or provider), so you can see where you are over- or under-invested. That moves the investment discussion from spend to priorities, exposure and expected impact, and where risk reduction is quantified, you can support the return on security investment. One management report brings risk, performance, cost and open actions together, ready for leadership.
Make security investment easier to explain and prioritise.
Platform capabilities
Modular by design. Connected in practice.
Not every organisation starts in the same place. Each area stands on its own, and all four share the same connected security data, so you can start with the one that matters most and let the picture grow.
Events & signals
Know what is happening on the ground
Risk & controls
Know where exposure remains
Performance & actions
Know your controls are working
Cost & priorities
Explain and prioritise the spend
SAM AI
Your connected security data
Analyse · Compare · Question · Summarise
Make full use of your security data
SAM AI brings together your security data to turn it into actionable management intelligence, from guard reports, incidents, and system events to risks and controls, provider performance, action status, and costs.
SAM AI analyses and consolidates this information, delivering insights where you need them, via emails and live dashboards, and helping you dive deeper into what matters most:
Automated daily & weekly summaries
Surface key deviations, anomalies, and priorities to support day-to-day operational management.
Site benchmarks & trends
Compare sites, track performance over time, and identify opportunities to improve and share lessons learned.
Structural recommendations
Correlate risks, controls, incidents, and performance data to recommend improvement plans that strengthen your security programme.
Site HQ-North · Week 33 · generated by SAM AI
Weekly security summary
Executive summary
Two near-incidents at the loading bay share one cause: the barrier closes too slowly after each passage. Barrier maintenance is overdue with the provider, so the vehicle access risk is rising until it is fixed.
- Near-incidents reported
- 2
- Controls below target
- 1
- Open recommendations
- 2
Data quality
Camera evidence is attached to both events. All sources reported this week.
Ask SAM AI
What should I do about the loading bay?
Answer
Both near-incidents trace to the slow barrier close, and its maintenance is overdue with your provider. Expedite that work under the existing contract and brief officers to hold vehicles until the barrier closes fully. That brings vehicle access risk back to its target.
- Near-incidents this week
- 2
- Barrier maintenance vs SLA
- Overdue
- Cost of the fix
- In contract
Ask it
No black box
SAM AI bases everything strictly on your data. It explicitly highlights incomplete data or system limitations to drive better data quality and deliver reliable insights.
From security data to management decisions
The same four questions, answered from one connected record.
What's happening?
Understand the events and signals across your environment without reading every individual report.
Where are we exposed?
Understand inherent risk, the controls in place, treatment progress and the residual exposure that still requires attention.
What needs attention?
Connect performance expectations with evidence, KPIs, planned activity and follow-up actions.
Where should we invest?
Review cost alongside performance and risk to support clearer budgeting, prioritisation and investment discussions.
The objective is not more security data. It is better visibility of exposure, performance, action and cost, in a form management can use.
Start where the need is greatest
You do not need to transform your entire security environment at once.
Operational starting point
Field guidance
Reporting
Management visibility
Management starting point
Visibility on controls and their performance
Managing and reducing risk
Connected management oversight
Ready for enterprise review.
Two ways forward.
Scope a Proof of Value
Agreed sites, users and success measures. Stop after it and nothing is committed; continue and it is credited against your first invoice.
Request a working session
For corporate security: your sites, your data, and the management output you need.